
SBI Life Insurance delivered a strong start to FY27. The company reported a 22% year-on-year rise in net profit to Rs 720 crore for the April-June 2026 quarter. Robust growth across premiums, new busi [...]

India’s equity derivatives market showed firm activity on Friday, July 24, 2026, as Nifty July futures traded at a notable premium to the spot index. The session drew significant participation f [...]
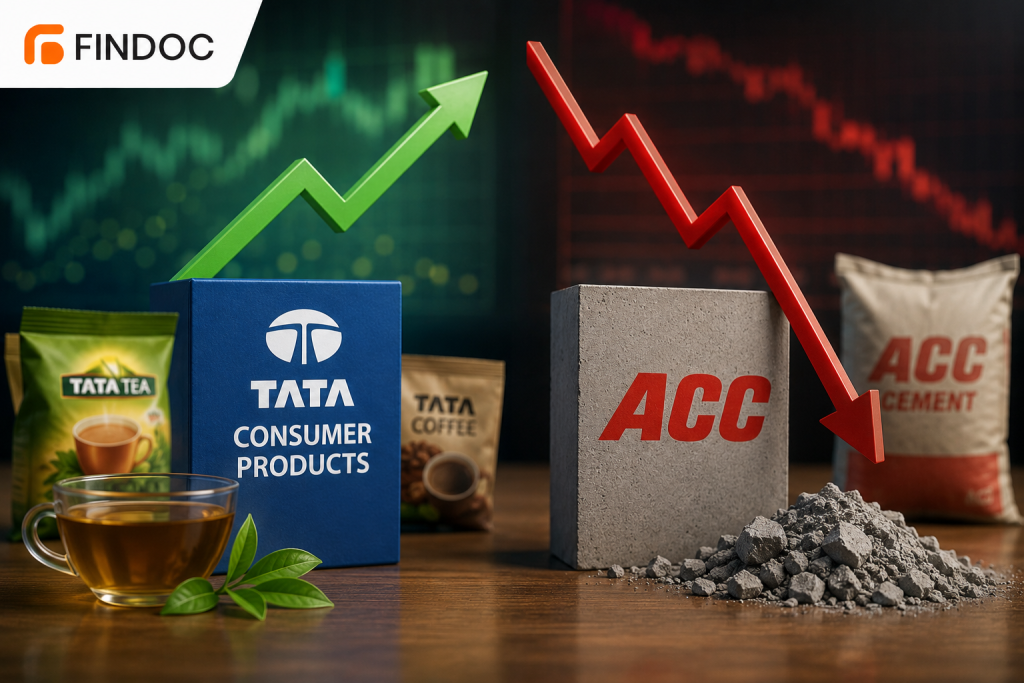
India’s first-quarter earnings season delivered a mixed picture on July 24, 2026. Several major companies reported their Q1 results, revealing sharp contrasts in performance across sectors. Tata [...]

Caliber Mining and Logistics made a notable stock market entry, but the excitement was short-lived. Shares debuted at a 19% premium over the IPO price, only to give back significant gains almost immed [...]

Mohammed Imran, a senior analyst at Mirae Asset, has issued a sharp warning about rising geopolitical risks in global energy markets. According to Imran, escalating tensions in the Red Sea and the Str [...]

Mirae Asset has issued a notable market advisory. The firm warns that rising oil prices could reduce gold’s appeal as a safe-haven asset. This shift may significantly affect how investors alloca [...]

Brent crude oil prices climbed above the $100 per barrel mark as geopolitical tensions escalated in the Middle East. Red Sea shipping disruptions and growing fears of a broader Iran-linked conflict pu [...]

Gold and silver prices staged a strong recovery recently, regaining upward momentum after a brief pullback. Meanwhile, crude oil dropped below the key $100-per-barrel level. These moves have drawn sig [...]